背景
偶然间,看到一个大佬的博客,展示博客热力图,灵机一动,我也想加一个 hhh,于是乎,说干就干!
准备
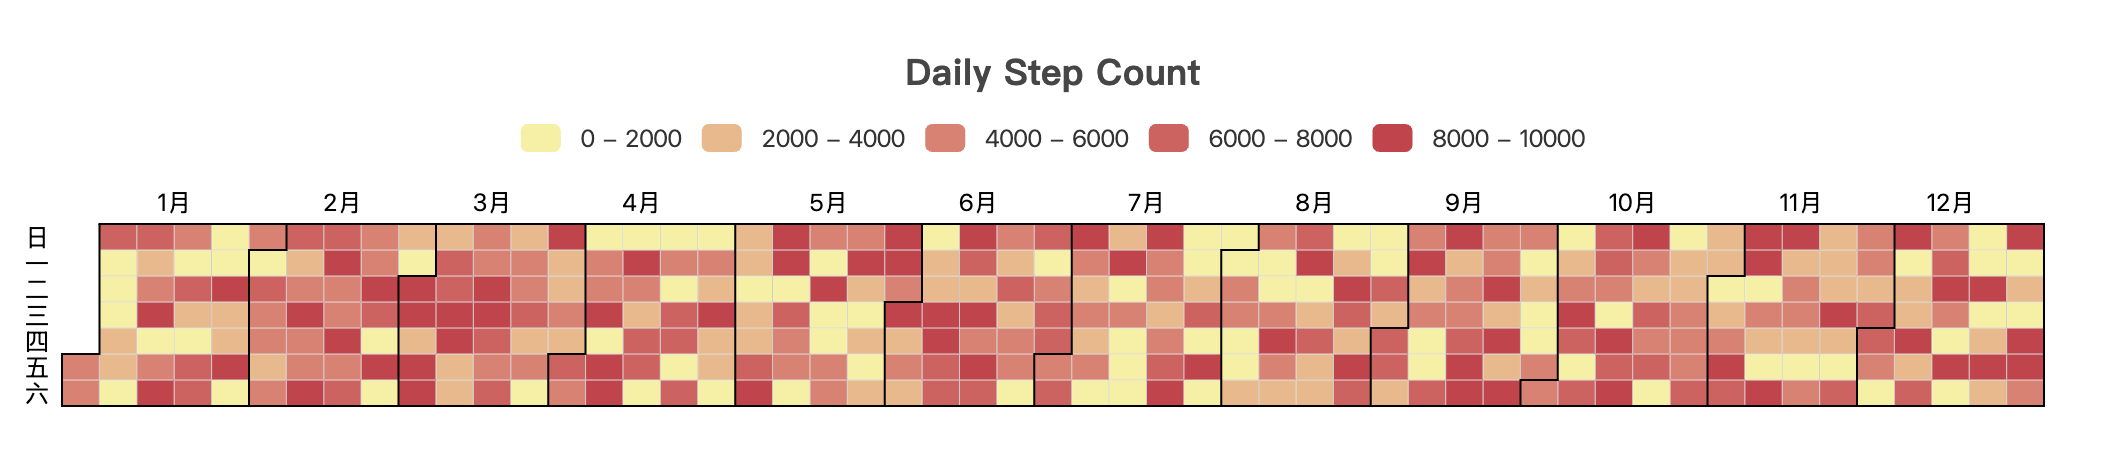
采用 echarts 制作热力图,网址:Examples - Apache ECharts
想实现功能:展示最近一年的博客更新信息,鼠标 hover 时,显示 title、date 以及字数,点击后,可以跳转对应的博客内容。
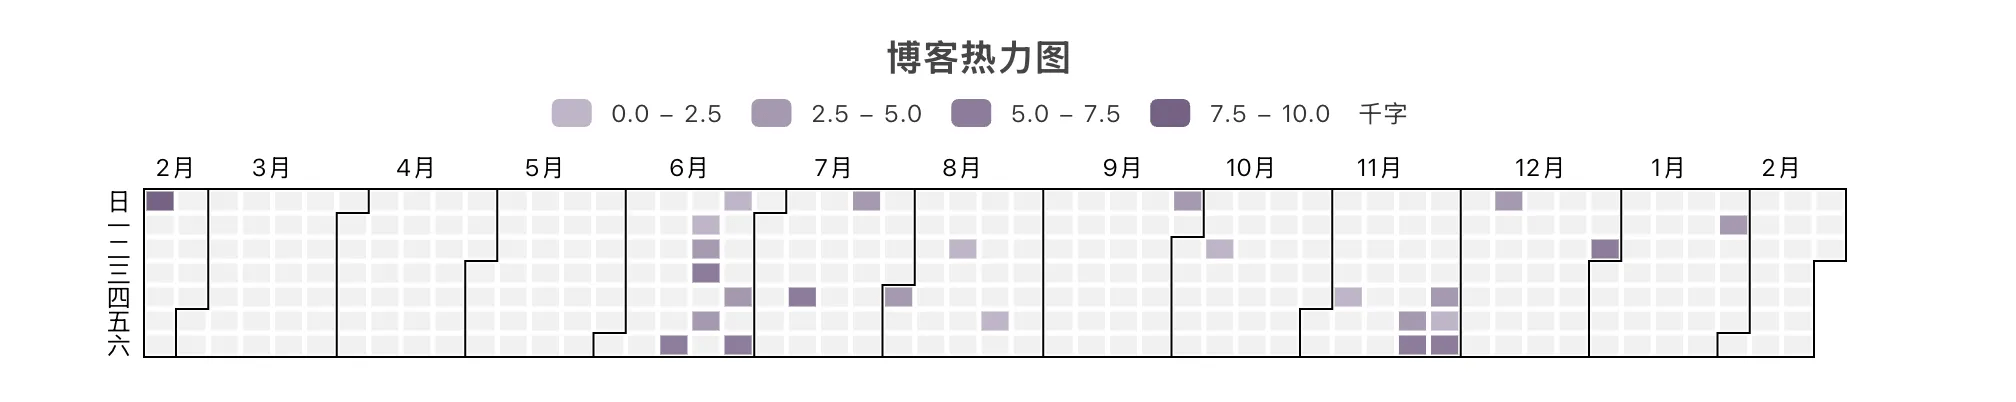
开问 AI,很快嗷,给出了一个显示热力图的模版,给力。但莫名的就是热力图不显示图例。
解决
搞了大半天,依旧 AI 没解决。
最后自己改吧,发现大佬这里,创建了两个 map,一个存储了 date、字数信息,另一个存储了 date、title、字数以及 url 信息。

在最后,给热力图传输数据的格式,是第一个 map「日期和字数」即可,而第二个 map「日期、字数、title 和 url」是给通过 date 的这个 key 获取到字数、title 和 url 这三个值的。直接给热力图传递第二个 map 是会匹配不上,所以导致热力图不显示图例。
全部代码
---
// 首页 热力图
import { getCollection } from 'astro:content'
import type { CollectionEntry } from 'astro:content'
import { formatDate } from '@support/time'

const posts: CollectionEntry<'posts'>[] = (await getCollection('posts'))
const postsData = posts.map(post => ({
  date: formatDate(post.data.pubDate),
  wordCount: post.body.length,
  title: post.data.title,
  url: `/posts/${post.slug}/`
}));
---

<div class="mx-auto w-4/5">
  <div id="heatmap" style="width: 100%;height:280px;"></div>
</div>
<!-- 通过CDN引入echarts -->
<script src="https://cdn.jsdelivr.net/npm/echarts@5.6.0/dist/echarts.min.js"></script>
<script define:vars={{ postsData }}>
  window.addEventListener('DOMContentLoaded', function() {
    var chartDom = document.getElementById('heatmap');
    if (!chartDom || !window.echarts) return;
    var myChart = window.echarts.init(chartDom);

    // 处理文章数据,按日期统计字数
    const dateMap = new Map();
    postsData.forEach(post => {
      const dateStr = post.date;
      const existing = dateMap.get(dateStr) || { wordCount: 0, titles: [], urls: [] };
      dateMap.set(dateStr, {
        wordCount: existing.wordCount + post.wordCount,
        title: post.title,  // 保留最新标题
        url: post.url      // 添加URL字段
      });
    });

    // 获取最大字数,用于设置visualMap的范围
    const maxWordCount = Math.max(...Array.from(dateMap.values()).map(item => item.wordCount));

    // 转换为热力图数据格式
    const dataArr = Array.from(dateMap).map(([date, { wordCount }]) => {
      return [date, wordCount];
    });

    // 计算日期范围
    function heatmap_width(months){
        var startDate = new Date();
        var mill = startDate.setMonth((startDate.getMonth() - months));
        var endDate = +new Date();
        startDate = +new Date(mill);
        endDate = echarts.format.formatTime('yyyy-MM-dd', endDate);
        startDate = echarts.format.formatTime('yyyy-MM-dd', startDate);
        var showmonth = [];
        showmonth.push([
            startDate,
            endDate
        ]);
        return showmonth
    };

    function getRangeArr() {
        const windowWidth = window.innerWidth;
        if (windowWidth >= 600) {
          return heatmap_width(12);
        }
        else if (windowWidth >= 400) {
          return heatmap_width(9);
        }
        else {
          return heatmap_width(6);
        }
    }

    const option = {
      title: {
        top: 20,  // 调整顶部间距适应新字体大小
        left: 'center',
        text: 'Blog Heat Map',
        textStyle: {
          fontSize: 30,  // 匹配 text-3xl (1.875rem = 30px)
          fontWeight: 'bold',
          color: '#1f2937', // 对应 text-neutral-800
          fontFamily: 'ui-sans-serif, system-ui' // 继承 Tailwind 默认字体
        }
      },
      visualMap: {
        type: 'piecewise',
        min: 0,
        max: maxWordCount,  // 确保这里有具体的数值
        orient: 'horizontal',
        left: 'center',
        top: 65,
        pieces: [
        //   {min: 0, max: 0, color: '#ebedf0'},          // 无数据时的颜色保持灰白
          {min: 1, max: 1000, color: '#ffd8cc'},       // 最浅的橙色
          {min: 1001, max: 3000, color: '#ffb199'},    // 浅橙色
          {min: 3001, max: 6000, color: '#ff8566'},    // 中等橙色
          {min: 6001, color: '#fa5a15'}                // 最深的橙色
        ]
      },
      tooltip: { // 鼠标悬停显示文章信息
        formatter: function (params) {
          // params.data[0]这里存储的是日期
          const post = dateMap.get(params.data[0]);
          return post.title + ' | ' + params.data[0] + ' | ' + post.wordCount + ' 字';
        }
      },
      calendar: {
        top: 120,
        left: 30,
        right: 30,
        cellSize: ['auto', 13],
        range: getRangeArr(),
        itemStyle: {
          borderWidth: 0.5
        },
        yearLabel: {
            show: true
        },
        dayLabel: {
          firstDay: 1, // 从周一开始
          nameMap: ['日', '一', '', '三', '', '五', '']
        },
        monthLabel: {
          nameMap: [
            '1月', '2月', '3月', '4月', '5月', '6月',
            '7月', '8月', '9月', '10月', '11月', '12月'
          ]
        }
      },
      series: {
        type: 'heatmap',
        coordinateSystem: 'calendar',
        data: dataArr
      }
    };

    myChart.setOption(option);

    // 添加点击事件监听(修复后的版本)
    myChart.on('click', function(params) {
      const post = dateMap.get(params.data[0]);
      const link = window.location.origin + post.url;
      window.open(link, '_blank').focus();
    });

  });
</script>
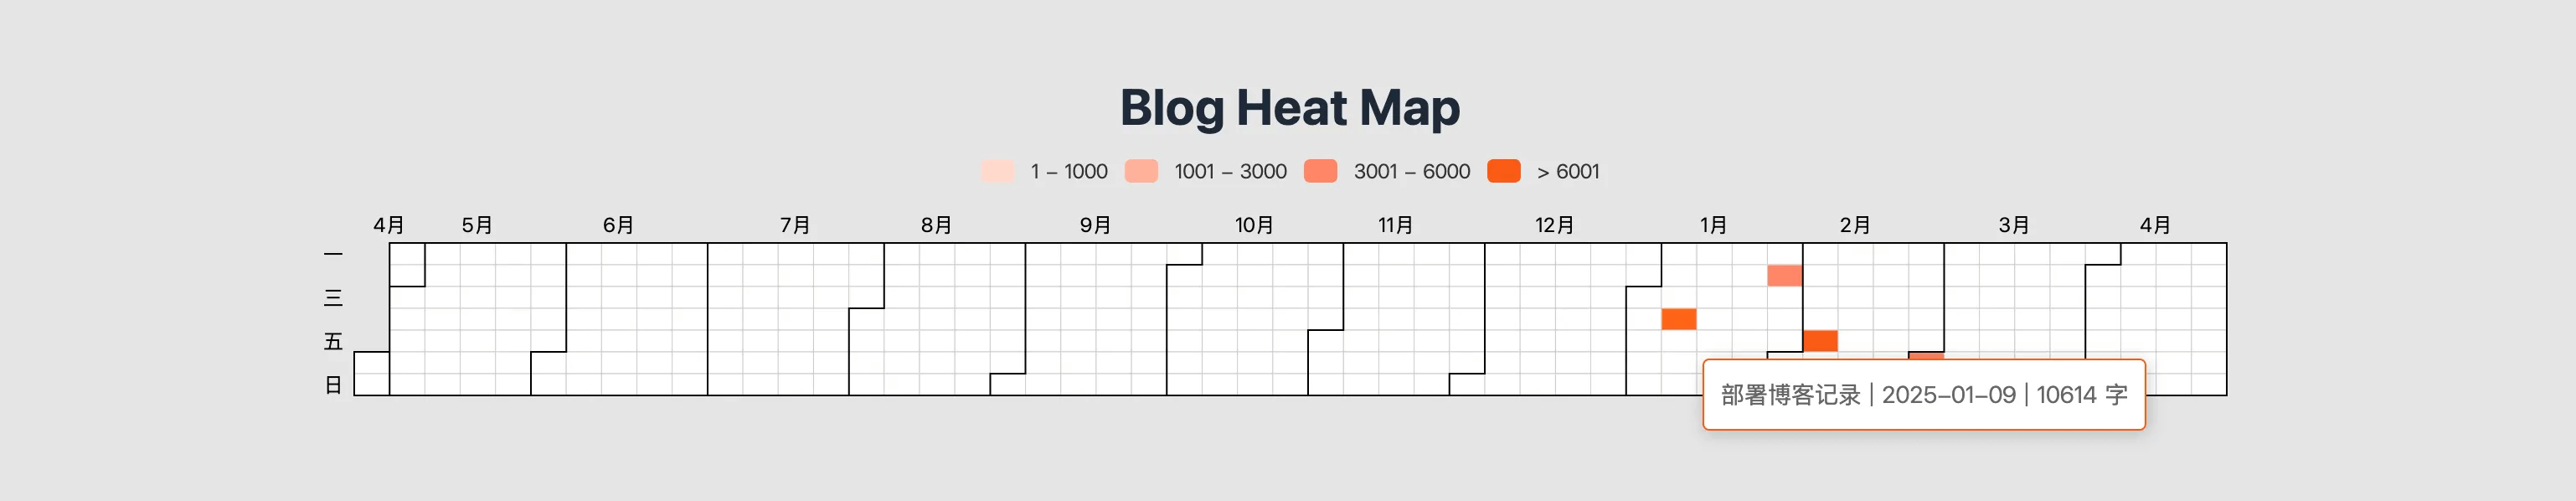
显示样式
点击即可跳转到对应的博客内容~
后续
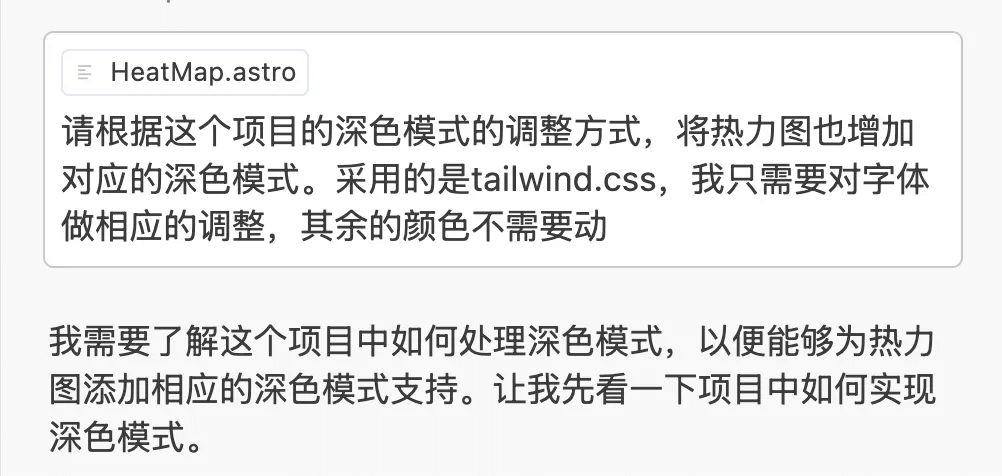
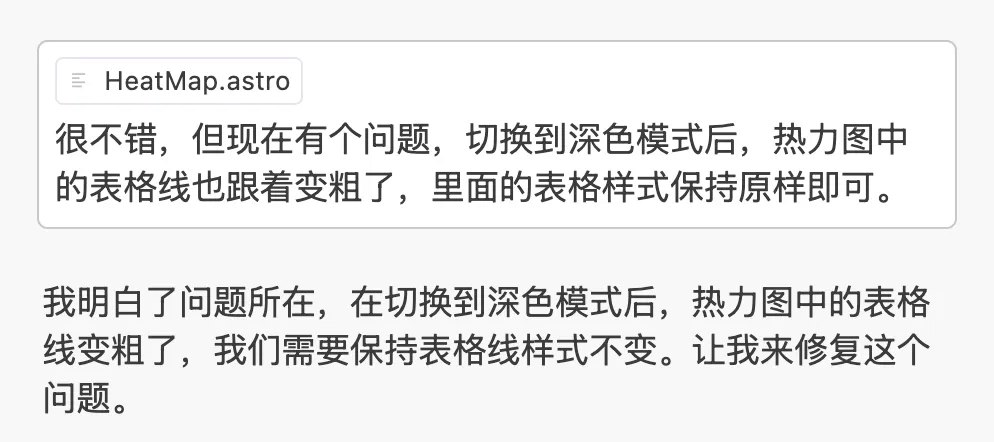
深色模式匹配还待调整…「现在深色情况下,完全没法看。」 更新 2025年04月27日19:12:26
用了claude-3.7-sonnet 模型去生成热力图的深色模式,真是太好用了 cursor,简简单单两句话搞定!用字节出的 trae 说的嘴皮子都磨破了,还不理解。
最终代码
---
// 首页 热力图
import { getCollection } from 'astro:content'
import type { CollectionEntry } from 'astro:content'
import { formatDate } from '@support/time'

const posts: CollectionEntry<'posts'>[] = (await getCollection('posts'))
const postsData = posts.map(post => ({
  date: formatDate(post.data.pubDate),
  wordCount: post.body.length,
  title: post.data.title,
  url: `/posts/${post.slug}/`
}));
---

<div class="mx-auto w-4/5">
  <div id="heatmap" style="width: 100%;height:280px;"></div>
</div>
<!-- 通过CDN引入echarts -->
<script src="https://cdn.jsdelivr.net/npm/echarts@5.6.0/dist/echarts.min.js"></script>
<script define:vars={{ postsData }}>
  window.addEventListener('DOMContentLoaded', function() {
    var chartDom = document.getElementById('heatmap');
    if (!chartDom || !window.echarts) return;
    var myChart = window.echarts.init(chartDom);

    // 处理文章数据,按日期统计字数
    const dateMap = new Map();
    postsData.forEach(post => {
      const dateStr = post.date;
      const existing = dateMap.get(dateStr) || { wordCount: 0, titles: [], urls: [] };
      dateMap.set(dateStr, {
        wordCount: existing.wordCount + post.wordCount,
        title: post.title,  // 保留最新标题
        url: post.url      // 添加URL字段
      });
    });

    // 获取最大字数,用于设置visualMap的范围
    const maxWordCount = Math.max(...Array.from(dateMap.values()).map(item => item.wordCount));

    // 转换为热力图数据格式
    const dataArr = Array.from(dateMap).map(([date, { wordCount }]) => {
      return [date, wordCount];
    });

    // 计算日期范围
    function heatmap_width(months){
        var startDate = new Date();
        var mill = startDate.setMonth((startDate.getMonth() - months));
        var endDate = +new Date();
        startDate = +new Date(mill);
        endDate = echarts.format.formatTime('yyyy-MM-dd', endDate);
        startDate = echarts.format.formatTime('yyyy-MM-dd', startDate);
        var showmonth = [];
        showmonth.push([
            startDate,
            endDate
        ]);
        return showmonth
    };

    function getRangeArr() {
        const windowWidth = window.innerWidth;
        if (windowWidth >= 600) {
          return heatmap_width(12);
        }
        else if (windowWidth >= 400) {
          return heatmap_width(9);
        }
        else {
          return heatmap_width(6);
        }
    }

    // 检测是否为深色模式
    const isDarkMode = document.documentElement.classList.contains('dark');

    const option = {
      title: {
        top: 20,  // 调整顶部间距适应新字体大小
        left: 'center',
        text: 'Blog Heat Map',
        textStyle: {
          fontSize: 30,  // 匹配 text-3xl (1.875rem = 30px)
          fontWeight: 'bold',
          color: isDarkMode ? '#e5e5e5' : '#1f2937', // 深色模式使用 neutral-200,浅色模式使用 neutral-800
          fontFamily: 'ui-sans-serif, system-ui' // 继承 Tailwind 默认字体
        }
      },
      visualMap: {
        type: 'piecewise',
        min: 0,
        max: maxWordCount,  // 确保这里有具体的数值
        orient: 'horizontal',
        left: 'center',
        top: 65,
        pieces: [
          // {min: 0, max: 0, color: '#ebedf0'},          // 无数据时的颜色保持灰白
          {min: 1, max: 1000, color: '#ffd8cc'},       // 最浅的橙色
          {min: 1001, max: 3000, color: '#ffb199'},    // 浅橙色
          {min: 3001, max: 6000, color: '#ff8566'},    // 中等橙色
          {min: 6001, color: '#fa5a15'}                // 最深的橙色
        ],
        textStyle: {
          color: isDarkMode ? '#d4d4d4' : '#525252' // 深色模式使用 neutral-300,浅色模式使用 neutral-600
        }
      },
      tooltip: { // 鼠标悬停显示文章信息
        formatter: function (params) {
          // params.data[0]这里存储的是日期
          const post = dateMap.get(params.data[0]);
          return post.title + ' | ' + params.data[0] + ' | ' + post.wordCount + ' 字';
        }
      },
      calendar: {
        top: 120,
        left: 30,
        right: 30,
        cellSize: ['auto', 13],
        range: getRangeArr(),
        itemStyle: {
          borderWidth: 0.5
        },
        yearLabel: {
          show: true,
          color: isDarkMode ? '#d4d4d4' : '#525252' // 深色模式使用 neutral-300,浅色模式使用 neutral-600
        },
        dayLabel: {
          firstDay: 1, // 从周一开始
          nameMap: ['日', '一', '', '三', '', '五', ''],
          color: isDarkMode ? '#d4d4d4' : '#525252' // 深色模式使用 neutral-300,浅色模式使用 neutral-600
        },
        monthLabel: {
          nameMap: [
            '1月', '2月', '3月', '4月', '5月', '6月',
            '7月', '8月', '9月', '10月', '11月', '12月'
          ],
          color: isDarkMode ? '#d4d4d4' : '#525252' // 深色模式使用 neutral-300,浅色模式使用 neutral-600
        }
      },
      series: {
        type: 'heatmap',
        coordinateSystem: 'calendar',
        data: dataArr
      }
    };

    myChart.setOption(option);

    // 添加点击事件监听(修复后的版本)
    myChart.on('click', function(params) {
      const post = dateMap.get(params.data[0]);
      const link = window.location.origin + post.url;
      window.open(link, '_blank').focus();
    });

    // 监听主题变化并重新渲染图表
    window.addEventListener('on-hs-appearance-change', function(e) {
      const isDark = e.detail === 'dark';

      // 更新文字颜色
      option.title.textStyle.color = isDark ? '#e5e5e5' : '#1f2937';
      option.visualMap.textStyle.color = isDark ? '#d4d4d4' : '#525252';
      option.calendar.yearLabel.color = isDark ? '#d4d4d4' : '#525252';
      option.calendar.dayLabel.color = isDark ? '#d4d4d4' : '#525252';
      option.calendar.monthLabel.color = isDark ? '#d4d4d4' : '#525252';

      // 重新应用配置
      myChart.setOption(option);
    });

  });
</script>
最终效果
